Monday 31 January 2022

MatplotLib: Data Science Library for Data Visualization

Matplotlib is the open source data science library of python which is used mainly for the visualization of data. The Pyplot package in the matplot library is helpful in plotting the 2-D figure. There are multiple type pf plot or graphs are present in matplotlib which is helpful in analysis of huge data by visualization like Line plot, bar plot, scatter plot, pie plot, histogram, Box plot

import numpy as np
import pandas as pd
import matplotlib.pyplot as plt

#1. Learn Matplotlib: Line graph
ps1 = pd.Series([5,9,13,18,21])
ps2 = pd.Series([2,8,9,11,4])
plt.plot(ps1,ps2)
plt.xlabel('x - axis: Series1')
plt.ylabel('y - axis: Series2')
plt.title('Learn Matplotlib')
plt.show()


#2. show data using file
df = pd.read_csv("data.csv")
df.plot()
plt.show()


#3. to show legend on the plot
ps1 = pd.Series([5,9,13,18,21])
ps2 = pd.Series([2,8,9,11,4])
ps3 = pd.Series([8,10,12,16,18])
plt.plot(ps1,ps2, label = "line 1")
plt.plot(ps1,ps3, label = "line 2")
plt.xlabel('x - axis: Series1')
plt.ylabel('y - axis: Series2')
plt.title('show-legend: Learn Matplotlib')
plt.legend()
plt.show()


#4. Show the line on the plot with different colors and width
ps1 = pd.Series([5,9,13,18,21])
ps2 = pd.Series([2,8,9,11,4])
ps3 = pd.Series([8,10,12,16,18])
plt.plot(ps1,ps2, color='Red', linewidth = 6,  label = "line 1")
plt.plot(ps1,ps3, color='blue', linewidth = 5,  label = "line 2")
plt.xlabel('x - axis: Series1')
plt.ylabel('y - axis: Series2')
plt.title('plot lines with different color and width: Learn Matplotlib')
plt.legend()
plt.show()


#5. plot lines with different linestyles
ps1 = pd.Series([5,9,13,18,21])
ps2 = pd.Series([2,8,9,11,4])
ps3 = pd.Series([8,10,12,16,18])
plt.plot(ps1,ps2, color='Red', linewidth = 2, linestyle='dashed', label = "line 1")
plt.plot(ps1,ps3, color='blue', linewidth = 3.5, linestyle='dotted', label = "line 2")
plt.xlabel('x - axis: Series1')
plt.ylabel('y - axis: Series2')
plt.title('plot lines with different linestyles: Learn Matplotlib')
plt.legend()
plt.show()


#6. plot lines with different line markers
ps1 = pd.Series([5,9,13,18,21])
ps2 = pd.Series([2,8,9,11,4])
ps3 = pd.Series([8,10,12,16,18])
plt.plot(ps1,ps2, color='Red', linewidth = 2, linestyle='dashed', marker='*', markerfacecolor='blue', markersize=6, label = "line 1")
plt.plot(ps1,ps3, color='blue', linewidth = 3.5, linestyle='dotted',marker='o', markerfacecolor='Red', markersize=6, label = "line 2")
plt.xlabel('x - axis: Series1')
plt.ylabel('y - axis: Series2')
plt.title('plot lines with different line markers: Learn Matplotlib')
plt.legend()
plt.show()


#7. set the new axis limit values on the plot, Limit x-axis 0 to 25, Limit y-axis 0 to 200
ps1 = pd.Series([5,9,13,18,21])
ps2 = pd.Series([50,123,145,161,189])
#new way to plot red line with 'o' marker
plt.plot(ps1,ps2, 'r-o', linewidth = 2, label = "line 1")
plt.axis([0, 25, 0, 200]) 
plt.xlabel('x - axis: Series1')
plt.ylabel('y - axis: Series2')
plt.title('plot lines with different line markers: Learn Matplotlib')
plt.show()


#8. plotting the grid
ps1 = pd.Series([5,9,13,18,21])
ps2 = pd.Series([50,123,145,161,189])
plt.plot(ps1,ps2, color='blue', linewidth = 2, label = "line 1")
plt.axis([0, 25, 0, 200]) 
plt.xlabel('x - axis: Series1')
plt.ylabel('y - axis: Series2')
plt.title('plot lines with different line markers: Learn Matplotlib')
plt.grid(linestyle='-', linewidth='1.5', color='orange')
plt.show()


#9. scatter plot
ps1 = pd.Series([5,9,13,18,21])
ps2 = pd.Series([2,8,9,11,4])
ps3 = pd.Series([8,10,12,16,18])
plt.scatter(ps1,ps2, color='Red',  label = "scatter 1")
plt.scatter(ps1,ps3, color='blue', label = "scatter 2")
plt.xlabel('x - axis: Series1')
plt.ylabel('y - axis: Series2')
plt.title('Scatter plot: Learn Matplotlib')
plt.legend()
plt.show()


#10. scatter plot using multiple random number
x1 = np.random.randn(100) 
y1 = np.random.randn(100)
plt.scatter(x1,y1, color='Red')
plt.xlabel('x - axis: Series1')
plt.ylabel('y - axis: Series2')
plt.title('Scatter plot with random number: Learn Matplotlib')
plt.show()


#11. changing the colour with empty circles in scatter plot
x1 = np.random.randn(100) 
y1 = np.random.randn(100)
plt.scatter(x1,y1, s=55, facecolors='none', edgecolors='green')
plt.xlabel('x - axis: Series1')
plt.ylabel('y - axis: Series2')
plt.title('Scatter plot with empty circles: Learn Matplotlib')
plt.show()


#12. Vertical Bar Chart
x =['CSE Jobs','IT Jobs', 'ECE Jobs','MAE jobs','Civil Jobs']
y=[50000,45000,30000,25000,21000]
plt.bar(x, y)
plt.xlabel("Jobs")
plt.ylabel("Num of Jobs")  
plt.title("Bar Chart: Vertical")
plt.show()


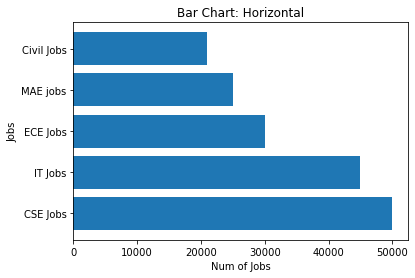
#13. Horizontal Bar Chart
y =['CSE Jobs','IT Jobs', 'ECE Jobs','MAE jobs','Civil Jobs']
x=[50000,45000,30000,25000,21000]
plt.barh(y, x)
plt.xlabel("Num of Jobs")
plt.ylabel("Jobs")  
plt.title("Bar Chart: Horizontal")
plt.show()


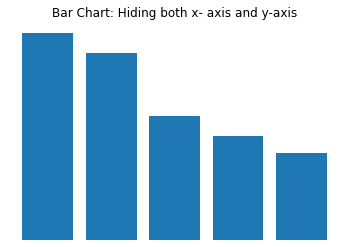
#14. To hide the both x-axis and y-axis in plot
x =['CSE Jobs','IT Jobs', 'ECE Jobs','MAE jobs','Civil Jobs']
y=[50000,45000,30000,25000,21000]
plt.bar(x, y)
plt.xlabel("Jobs")
plt.ylabel("Num of Jobs")  
plt.title("Bar Chart: Hiding both x- axis and y-axis")
plt.axis('off')
plt.show()


#15. If only need to hide/ off either x-axis or y-axis. We can use plt.xticks() and plt.yticks()
x =['CSE Jobs','IT Jobs', 'ECE Jobs','MAE jobs','Civil Jobs']
y=[50000,45000,30000,25000,21000]
plt.bar(x, y)
plt.xlabel("Jobs")
plt.ylabel("Num of Jobs")  
plt.title("Bar Chart: Hiding only x- axis")
plt.xticks([])
plt.show()


#16. Saving the plot using savefig() and bbox_inches ='tight' to remove/hide whitespace around border
x =['CSE Jobs','IT Jobs', 'ECE Jobs','MAE jobs','Civil Jobs']
y=[50000,45000,30000,25000,21000]
plt.bar(x, y)
plt.xlabel("Jobs")
plt.ylabel("Num of Jobs")  
plt.title("Bar Chart: Saving the plot using savefig")
plt.savefig('Bar_Chart_pratice.png', bbox_inches='tight', pad_inches=0)
plt.show()


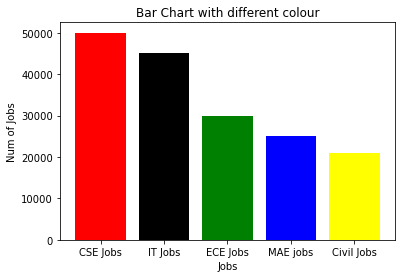
#17. Display the Bar chart with different colour of Bar
x =['CSE Jobs','IT Jobs', 'ECE Jobs','MAE jobs','Civil Jobs']
y=[50000,45000,30000,25000,21000]
plt.bar(x, y,color=['red', 'black', 'green', 'blue', 'yellow'])
plt.xlabel("Jobs")
plt.ylabel("Num of Jobs")  
plt.title("Bar Chart with different colour")
plt.show()


#18. Pie chart
Jobs =['CSE Jobs','IT Jobs', 'ECE Jobs','MAE jobs','Civil Jobs']
Percent=[50,45,30,25,21]
fig = plt.figure(figsize =(10, 7))
plt.pie(Percent,labels=Jobs)
plt.title("Pie Chart")
plt.show()


#19. Learn Distribution Graph: Histogram
x = 2 +3*(np.random.randn(1000))
fig = plt.figure(figsize=(8,6))
ax = fig.add_subplot(111)
ax.set(title="Distribution Graph: Histogram", xlabel='Percentage',ylabel='Count')
ax.hist(x)
plt.show()


#20. Setting the color of bar and number of bins in Histogram
x = 2 +3*(np.random.randn(1000))
fig = plt.figure(figsize=(8,6))
ax = fig.add_subplot(111)
ax.set(title="Distribution Graph: Histogram with changed colors and bins", xlabel='Percentage',ylabel='Count')
ax.hist(x, color='Red', bins=30, density=True)
plt.show()


#21. Box plot: to visulaize the spread of data, detect outliers
x = 2 +3*(np.random.randn(1000))
fig = plt.figure(figsize=(8,6))
ax = fig.add_subplot(111)
ax.set(title="Box Plot", xlabel='Student Class',ylabel='Percentage of Student')
ax.boxplot(x)
plt.show()


#22. Box plot with Notch, bootstrap, Vert
#Notch: It will be True if notches created around median. Bootstrap number will show that notches around the median are bootstrapped
x = 2 + 3*np.random.randn(1000)
y = 4 + 5*np.random.randn(1000)
fig = plt.figure(figsize=(8,6))
ax = fig.add_subplot(111)
ax.set(title="Box plot of Student's Percentage",
      xlabel='Class', ylabel='Percentage')
ax.boxplot([x, y], labels=['Class A', 'Class B'], notch=True, bootstrap=15000)
plt.show()


#23. Horizontal Box Plot using vert. Vert will be False for plotting Box plots horizontally
x = 2 + 3*np.random.randn(1000)
y = 4 + 5*np.random.randn(1000)
fig = plt.figure(figsize=(8,6))
ax = fig.add_subplot(111)
ax.set(title="Box plot of Student's Percentage",
      xlabel='Class', ylabel='Percentage')
ax.boxplot([x, y], labels=['Class A', 'Class B'], notch=True, bootstrap=15000, vert=False)
plt.show()


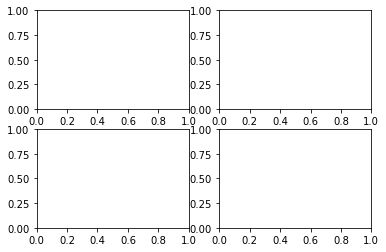
#24. Creating subplot with same rows and columns but with different index value.
fig = plt.figure(figsize=(6,4))
ax1 = plt.subplot(221)
ax2 = plt.subplot(222)
ax3 = plt.subplot(223)
ax4 = plt.subplot(224)
plt.show()


#25. Creating different subplot
fig = plt.figure(figsize=(6,4))
ax1 = plt.subplot(2,2,(1,2))
ax3 = plt.subplot(223)
ax4 = plt.subplot(224)
plt.show()


Pandas Practice: Data Science Library in Python

Pandas, an open source data science library of python which is used mainly for the analyses, cleaning and manipulation of data. Pandas allow to load the data, clean and manipulate the complex big data, and  based on this, analysis is done on clean data and make conclusions. Pandas library is very fast and give very high performance on large datasets also. 

Python provide Series (1-D array) and Dataframe (2-D array) in manipulating the data. The data can be loaded in both Series and Dataframe from array, list, dictionary, tuple, CSV files, excel files, SQL database..

Below are the set of  multiple questions which will help to give the basic knowledge of all type of programming of Pandas Data science library in Python. You can visit website https://https://www.w3resource.com/python-exercises/pandas/ or https://www.geeksforgeeks.org/python-pandas-practice-exercises-questions-and-solutions/

Steps to run below programs:

  1. Install Anaconda in your PC/ Laptop.
  2. Open Spyder.
  3. Copy and paste below programs.
  4. Press Run button. You can see the result in Console section at right side.
#1. Create 1-Dimensional array of data using Series in Pandas and then convert that series again into list
import pandas as pd
import numpy as np
ps = pd.Series([5,9,13,8,15])
print("1-Dimensional array of data using Series :")
print(ps)
list =ps.tolist()
print("convert series again into list :")
print(list)

#2. Addition and multiplication of two pandas series
ps1 = pd.Series([5,9,13,8,15])
ps2 = pd.Series([2,8,9,11,4])
ps_add= ps1+ps2
ps_mul= ps1*ps2
print("Addition of two pandas series :")
print(ps_add)
print("Multiplication of two pandas series :")
print(ps_mul)

#3. Change Dicionary and numpy array into pandas Series
dict ={'x':1000, 'y':2000, 'z':3000}
dict_to_series = pd.Series(dict)
print("convert Dictionary into pandas :")
print(dict_to_series)
num_array = np.array([5,9,13,8,15])
numpy_to_Series = pd.Series(num_array)
print("convert numpy into pandas :")
print(numpy_to_Series)

#4. Adding some new data to existing Series
ps = pd.Series([2, 8, 12, 'data', 'series', 21])
new_ps = ps.append(pd.Series(['numpy',32]))
print("Adding some new data to existing Series :")
print(new_ps)

#5. Reindexing or change the order of existing series data
ps = pd.Series(data=[2, 8, 12, 'data', 'series', 21], index=['a','b','c','d','e','f'])
reindex_ps= ps.reindex(index=['c','e','f','b','a','b'])
print("Reindexing or change the order of existing series data :")
print(reindex_ps)

#6. Calculate the mean, Standard deviation, median, minimum value and maximum value of given data
#Note 0 percetile is the minimum value, 50th percentile is median and 100th is maximum value
data =pd.Series([12,23,14,27,9,22,34,19,26,31,45])
print("Mean of given data is :", data.mean())
print("Standard deviation of given data is :", data.std())
print("Minimum value, 25th Percentile, median, 75th percentile, maximum of the given series are :")
data_percentile= np.percentile(data, q=[0,25,50,75,100])
print(data_percentile)

#7. Generate Series from random number and calculate the unique count of numbers from that series
ps = pd.Series(np.random.randint(10,size =20))
print("Random Series values are :", ps)
count =ps.value_counts()
print("Frequancy of each number are :", count)

#8. Change series of date strings to a timeseries
series_date = pd.Series(['25 Jan 2022', '20210408', '2022/05/12', '21-02-2020', '2021-09-11', '2021-10-10T12:20'])
print("Changed series of date strings to a timeseries :")
print(pd.to_datetime(series_date))

#9. Create Dataframe using list
list =[['Akansha', 'TCS', 32],['Ashish','HCL',32],['Ankit','Canara',35]]
df = pd.DataFrame(list,columns=['Name','Organization','Age'])
print("Dataframe using list :")
print(df)

#10.Create Dataframe using Series
num_name = ['Abhishek','Sahil','Swati','Rohan','Prerna']
num_age = [5,9,13,8,15]
num_name_series=pd.Series(num_name)
num_age_series = pd.Series(num_age)
df = {'num_name':num_name_series, 'num_age':num_age_series}
Dataframe = pd.DataFrame(df)
print("Dataframe using Series :")
print(Dataframe)

#11. Create dataframe using dictionary
dict={'num_name':['Aakansha','Rohan','Isha','Ashish','Prerna'], 'num_age':[5,9,13,8,15]}
df = pd.DataFrame(dict)
print("Dataframe using dictionary :")
print(df)

#12. Create dataframe using random values
index =['I1','I2','I3','I4','I5']
Col=['C1','C2','C3','C4','C5']
df = pd.DataFrame(np.random.rand(5,5), index=index, columns=Col)
print("Dataframe using random values :")
print(df)
df.reindex(['C3','C5','C1','C4','C2'])
print("Dataframe after reindexing :", df)

#13. Iteration in Dataframe
dict11={'num_name':['Aakansha','Rohan','Isha','Ashish','Prerna'],'Organization':['TCS','HCL','Infosys','Sopra','TCS'], 'num_age':[5,9,13,8,15],'Salary':[30000,45000,33000,44000,20000]}
df11 = pd.DataFrame(dict11)
print("Iteration in Dataframe :")
print(df11)
Condition_res=df11[df11['Salary']>40000]
print(Condition_res)

#14. Iteration using loc[] function
print("Iteration using loc[] function :")
for i in range(len(df11)):
    print(df11.loc[i,"num_name"],df11.loc[i,"Salary"])

for i in range(len(df11)):
    print(df11.iloc[i,0], df11.iloc[i,2])

print(df11.loc[1:2,['num_name','num_age']])

#15. Filtering Row 1 and all columns using 'loc' function
print("Filtering Row 1 and all columns using 'loc' function :")
print(df11.loc[0,:]) 
print(df11.iloc[1:3,0:2]) #iloc provide both row and column slicing

#16. To find the shape of the dataframe
print("shape of the dataframe :")
print(df11.shape)

#17. To find the first two rows of any dataframe
print("first two rows of any dataframe :")
print(df11.head(2))

#18. Finding the maximum value in the particular column of dataframe
print("maximum value in the particular column of dataframe :") 
print(df11.Salary.max()) #finding maximum salary

#19. To find maximum value of all column
print("maximum value of all column :")
print(df11.max()) #finding maximum in all columns

#20. Finding row which has the maximum salary
print("Finding row which has the maximum salary :")
print(df11[df11.Salary == df11.Salary.max()])

#21. Similar as above for max, Finding the minimum value in the particular column of dataframe 
print("minimum value in the particular column of dataframe  :")
print(df11.Salary.min()) #finding minimum salary

#22. Finding row which has the minimum salary
print("Finding row which has the minimum salary :")
print(df11[df11.Salary == df11.Salary.min()])

#23. Filtering for the 'TCS organization' with 'Aakansha' name
print("Filtering for the 'TCS organization' with 'Aakansha' name :")
Res = df11[df11['Organization'].str.contains("TCS") & df11['num_name'].str.contains("Aakansha")]
print(Res)

#24. Renaming the column name
print("Renaming the column name :")
df11.columns =['NAME', 'ORGANIZATION','AGE','SALARY']
print(df11.columns)

#25. Fetching unique values of column
print("Fetching unique values of column :")
print(df11.ORGANIZATION.unique())

#26. Fetching frequancy counts of columns
print("Fetching frequancy counts of columns :")
print(df11.ORGANIZATION.value_counts())

#27. Lowercase column name
print("Lowercase column name :")
df11['ORGANIZATION']=df11['ORGANIZATION'].str.lower()
print(df11) 

#28. Uppercase column name
print(" Uppercase column name :")
df11['NAME']=df11['NAME'].str.upper()
print(df11) 

#29. Capitalize first letter in the column
print(" Capitalize first letter in the column :")
df11['ORGANIZATION']=df11['ORGANIZATION'].str.capitalize()
print(df11) 

#30. Dropping 'NAME and AGE' column
print("Dropping 'NAME and AGE' column :")
df11.drop(df11.columns[[0, 2]], axis = 1, inplace = True)
print(df11)

#31. Reading CSV files using read_csv
print("Reading CSV files using read_csv :")
dataframe = pd.read_csv("data.csv")

#32. Finding column names in given csv file
print("Finding column names in given csv file :")
print(dataframe.columns)

#33. Finding first 10 rows in the csv file
print("Finding first 10 rows in the csv file :")
print(dataframe.head(10))

#34. Finding the type of column 'fractal_dimension_worst'
print("Finding the type of column 'fractal_dimension_worst' :")
print(dataframe['fractal_dimension_worst'].dtypes)

#35. Finding last 10 rows from csv file
print("Finding last 10 rows from csv file :")
print(dataframe.tail(10))

#36. Give detail information of csv file
print("Give detail information of csv file :")
print(dataframe.info())

#37. dropna(inplace = True) will remove all rows which contain NULL values from the DataFrame without any change in original DF.
#dataframe.dropna(inplace=True)

#38. Replace NULL values in the particular columns with 75:
print("Replace NULL values in the particular columns with 75 :")
dataframe["radius_worst"].fillna(75, inplace = True)

#39. Replacing null values in the column with either mean, median or mode
print("Replacing null values in the column with either mean, median or mode :")
rp = dataframe["radius_worst"].median()
dataframe["radius_worst"].fillna(rp, inplace = True)

#40. If you want to drop rows with some condition
for i in dataframe.index:
    if dataframe.loc[i,"fractal_dimension_worst"]<0.03:
        dataframe.drop(i,inplace =True)
print('To find value less than 0.03 :', dataframe[dataframe['fractal_dimension_worst']<0.03])

#41. if you want to replace any particular value, here 15 is the row
print(" if you want to replace any particular value, here 15 is the row :")
dataframe.loc[15,'fractal_dimension_worst']=0.1
print(dataframe.loc[15,'fractal_dimension_worst'])

#42. Finding first 2 columns
print("Finding first 2 columns :")
print(dataframe.iloc[:,:2].head())

Result of above Exercise

1-Dimensional array of data using Series :
0     5
1     9
2    13
3     8
4    15
dtype: int64

convert series again into list :
[5, 9, 13, 8, 15]

Addition of two pandas series :
0     7
1    17
2    22
3    19
4    19
dtype: int64

Multiplication of two pandas series :
0     10
1     72
2    117
3     88
4     60
dtype: int64

convert Dictionary into pandas :
x    1000
y    2000
z    3000
dtype: int64

convert numpy into pandas :
0     5
1     9
2    13
3     8
4    15
dtype: int32

Adding some new data to existing Series :
0         2
1         8
2        12
3      data
4    series
5        21
0     numpy
1        32
dtype: object

Reindexing or change the order of existing series data :
c        12
e    series
f        21
b         8
a         2
b         8
dtype: object

Mean of given data is : 23.818181818181817

Standard deviation of given data is : 10.495886640186066

Minimum value, 25th Percentile, median, 75th percentile, maximum of the given series are :
[ 9.  16.5 23.  29.  45. ]

Random Series values are : 0     3
1     0
2     6
3     8
4     0
5     4
6     1
7     1
8     7
9     3
10    6
11    0
12    7
13    2
14    3
15    9
16    0
17    1
18    3
19    9
dtype: int32

Frequancy of each number are : 3    4
0    4
1    3
6    2
7    2
9    2
8    1
4    1
2    1
dtype: int64

Changed series of date strings to a timeseries :
0   2022-01-25 00:00:00
1   2021-04-08 00:00:00
2   2022-05-12 00:00:00
3   2020-02-21 00:00:00
4   2021-09-11 00:00:00
5   2021-10-10 12:20:00
dtype: datetime64[ns]

Dataframe using list :
      Name Organization  Age
0  Akansha          TCS   32
1   Ashish          HCL   32
2    Ankit       Canara   35

Dataframe using Series :
   num_name  num_age
0  Abhishek        5
1     Sahil        9
2     Swati       13
3     Rohan        8
4    Prerna       15

Dataframe using dictionary :
   num_name  num_age
0  Aakansha        5
1     Rohan        9
2      Isha       13
3    Ashish        8
4    Prerna       15

Dataframe using random values :
          C1        C2        C3        C4        C5
I1  0.896202  0.999017  0.374783  0.152988  0.538044
I2  0.326453  0.883428  0.110783  0.508416  0.194583
I3  0.109798  0.545732  0.977045  0.726761  0.032932
I4  0.655264  0.194990  0.429043  0.810116  0.453745
I5  0.137495  0.902280  0.576180  0.931368  0.271951

Dataframe after reindexing :           C1        C2        C3        C4        C5
I1  0.896202  0.999017  0.374783  0.152988  0.538044
I2  0.326453  0.883428  0.110783  0.508416  0.194583
I3  0.109798  0.545732  0.977045  0.726761  0.032932
I4  0.655264  0.194990  0.429043  0.810116  0.453745
I5  0.137495  0.902280  0.576180  0.931368  0.271951

Iteration in Dataframe :
   num_name Organization  num_age  Salary
0  Aakansha          TCS        5   30000
1     Rohan          HCL        9   45000
2      Isha      Infosys       13   33000
3    Ashish        Sopra        8   44000
4    Prerna          TCS       15   20000
  num_name Organization  num_age  Salary
1    Rohan          HCL        9   45000
3   Ashish        Sopra        8   44000

Iteration using loc[] function :
Aakansha 30000
Rohan 45000
Isha 33000
Ashish 44000
Prerna 20000
Aakansha 5
Rohan 9
Isha 13
Ashish 8
Prerna 15
  num_name  num_age
1    Rohan        9
2     Isha       13

Filtering Row 1 and all columns using 'loc' function :
num_name        Aakansha
Organization         TCS
num_age                5
Salary             30000
Name: 0, dtype: object
  num_name Organization
1    Rohan          HCL
2     Isha      Infosys

shape of the dataframe :
(5, 4)

first two rows of any dataframe :
   num_name Organization  num_age  Salary
0  Aakansha          TCS        5   30000
1     Rohan          HCL        9   45000

maximum value in the particular column of dataframe :
45000

maximum value of all column :
num_name        Rohan
Organization      TCS
num_age            15
Salary          45000
dtype: object

Finding row which has the maximum salary :
  num_name Organization  num_age  Salary
1    Rohan          HCL        9   45000

minimum value in the particular column of dataframe  :
20000

Finding row which has the minimum salary :
  num_name Organization  num_age  Salary
4   Prerna          TCS       15   20000

Filtering for the 'TCS organization' with 'Aakansha' name :
   num_name Organization  num_age  Salary
0  Aakansha          TCS        5   30000

Renaming the column name :
Index(['NAME', 'ORGANIZATION', 'AGE', 'SALARY'], dtype='object')

Fetching unique values of column :
['TCS' 'HCL' 'Infosys' 'Sopra']

Fetching frequancy counts of columns :
TCS        2
HCL        1
Infosys    1
Sopra      1
Name: ORGANIZATION, dtype: int64

Lowercase column name :
       NAME ORGANIZATION  AGE  SALARY
0  Aakansha          tcs    5   30000
1     Rohan          hcl    9   45000
2      Isha      infosys   13   33000
3    Ashish        sopra    8   44000
4    Prerna          tcs   15   20000

 Uppercase column name :
       NAME ORGANIZATION  AGE  SALARY
0  AAKANSHA          tcs    5   30000
1     ROHAN          hcl    9   45000
2      ISHA      infosys   13   33000
3    ASHISH        sopra    8   44000
4    PRERNA          tcs   15   20000

 Capitalize first letter in the column :
       NAME ORGANIZATION  AGE  SALARY
0  AAKANSHA          Tcs    5   30000
1     ROHAN          Hcl    9   45000
2      ISHA      Infosys   13   33000
3    ASHISH        Sopra    8   44000
4    PRERNA          Tcs   15   20000

Dropping 'NAME and AGE' column :
  ORGANIZATION  SALARY
0          Tcs   30000
1          Hcl   45000
2      Infosys   33000
3        Sopra   44000
4          Tcs   20000

Reading CSV files using read_csv :

Finding column names in given csv file :
Index(['id', 'diagnosis', 'radius_mean', 'texture_mean', 'perimeter_mean',
       'area_mean', 'smoothness_mean', 'compactness_mean', 'concavity_mean',
       'concave points_mean', 'symmetry_mean', 'fractal_dimension_mean',
       'radius_se', 'texture_se', 'perimeter_se', 'area_se', 'smoothness_se',
       'compactness_se', 'concavity_se', 'concave points_se', 'symmetry_se',
       'fractal_dimension_se', 'radius_worst', 'texture_worst',
       'perimeter_worst', 'area_worst', 'smoothness_worst',
       'compactness_worst', 'concavity_worst', 'concave points_worst',
       'symmetry_worst', 'fractal_dimension_worst', 'Unnamed: 32'],
      dtype='object')

Finding first 10 rows in the csv file :
         id diagnosis  ...  fractal_dimension_worst  Unnamed: 32
0    842302         M  ...                  0.11890          NaN
1    842517         M  ...                  0.08902          NaN
2  84300903         M  ...                  0.08758          NaN
3  84348301         M  ...                  0.17300          NaN
4  84358402         M  ...                  0.07678          NaN
5    843786         M  ...                  0.12440          NaN
6    844359         M  ...                  0.08368          NaN
7  84458202         M  ...                  0.11510          NaN
8    844981         M  ...                  0.10720          NaN
9  84501001         M  ...                  0.20750          NaN

[10 rows x 33 columns]

Finding the type of column 'fractal_dimension_worst' :
float64

Finding last 10 rows from csv file :
         id diagnosis  ...  fractal_dimension_worst  Unnamed: 32
559  925291         B  ...                  0.08732          NaN
560  925292         B  ...                  0.08321          NaN
561  925311         B  ...                  0.05905          NaN
562  925622         M  ...                  0.14090          NaN
563  926125         M  ...                  0.09873          NaN
564  926424         M  ...                  0.07115          NaN
565  926682         M  ...                  0.06637          NaN
566  926954         M  ...                  0.07820          NaN
567  927241         M  ...                  0.12400          NaN
568   92751         B  ...                  0.07039          NaN

[10 rows x 33 columns]

Give detail information of csv file :
<class 'pandas.core.frame.DataFrame'>
RangeIndex: 569 entries, 0 to 568
Data columns (total 33 columns):
 #   Column                   Non-Null Count  Dtype  
---  ------                   --------------  -----  
 0   id                       569 non-null    int64  
 1   diagnosis                569 non-null    object 
 2   radius_mean              569 non-null    float64
 3   texture_mean             569 non-null    float64
 4   perimeter_mean           569 non-null    float64
 5   area_mean                569 non-null    float64
 6   smoothness_mean          569 non-null    float64
 7   compactness_mean         569 non-null    float64
 8   concavity_mean           569 non-null    float64
 9   concave points_mean      569 non-null    float64
 10  symmetry_mean            569 non-null    float64
 11  fractal_dimension_mean   569 non-null    float64
 12  radius_se                569 non-null    float64
 13  texture_se               569 non-null    float64
 14  perimeter_se             569 non-null    float64
 15  area_se                  569 non-null    float64
 16  smoothness_se            569 non-null    float64
 17  compactness_se           569 non-null    float64
 18  concavity_se             569 non-null    float64
 19  concave points_se        569 non-null    float64
 20  symmetry_se              569 non-null    float64
 21  fractal_dimension_se     569 non-null    float64
 22  radius_worst             569 non-null    float64
 23  texture_worst            569 non-null    float64
 24  perimeter_worst          569 non-null    float64
 25  area_worst               569 non-null    float64
 26  smoothness_worst         569 non-null    float64
 27  compactness_worst        569 non-null    float64
 28  concavity_worst          569 non-null    float64
 29  concave points_worst     569 non-null    float64
 30  symmetry_worst           569 non-null    float64
 31  fractal_dimension_worst  569 non-null    float64
 32  Unnamed: 32              0 non-null      float64
dtypes: float64(31), int64(1), object(1)
memory usage: 146.8+ KB
None

Replace NULL values in the particular columns with 75 :

Replacing null values in the column with either mean, median or mode :

To find value less than 0.03 : Empty DataFrame
Columns: [id, diagnosis, radius_mean, texture_mean, perimeter_mean, area_mean, smoothness_mean, compactness_mean, concavity_mean, concave points_mean, symmetry_mean, fractal_dimension_mean, radius_se, texture_se, perimeter_se, area_se, smoothness_se, compactness_se, concavity_se, concave points_se, symmetry_se, fractal_dimension_se, radius_worst, texture_worst, perimeter_worst, area_worst, smoothness_worst, compactness_worst, concavity_worst, concave points_worst, symmetry_worst, fractal_dimension_worst, Unnamed: 32]
Index: []

 if you want to replace any particular value, here 15 is the row :
0.1

Finding first 2 columns :
         id diagnosis
0    842302         M
1    842517         M
2  84300903         M
3  84348301         M
4  84358402         M


Wednesday 19 January 2022

Python Exercise on loops, Function and some common python programs

Below are the set of  multiple questions which will help to give the basic knowledge of the loops in python and how to display the different patterns using python. This section also contain some basic common python programs along with some question on Functions. 

Steps to run below programs:

  1. Install Anaconda in your PC/ Laptop.
  2. Open Spyder.
  3. Copy and paste below programs.
  4. Press Run button. You can see the result in Console section at right side.
  5. Result of all the below program is given in the last 'Result' Section.

#1. Program to calculate the sum of all numbers from 1 to given number by user.

num = int(input("Enter Number to calculate sum :"))

sum=0

for i in range (1, num+1):

    sum = sum +i

print("Sum of the all numbers :", sum)


#2. Program to count total digits in a given number

digit_num = 856938

count=0

while (digit_num != 0):

    digit_num = digit_num // 10

    count = count +1

print ("count of all digits in given number :", count)


#3. Program to show numbers from -5 to -1

print("Numbers from -5 to -1 are :")

for i in range(-5, 0, 1):

    print(i, end=' ')


print (" ")    

#4. Program of Fibonacci series upto 10 when first two numbers are 0 and 1

n1=0

n2=1

print("Fibonacci series upto 10 numbers are :")

for i in range(10):

    print (n1, end =' ')

    n3 = n1 + n2

    n1 = n2

    n2 = n3

print(" ")


#5. Program to display all prime numbers upto 2 to 20 numbers

#Note: all prime numubers are greater than 1

print ("All prime numbers upto 2 to 20 numbers are :")

for num in range(2, 21):

    if (num>1):

        for i in range(2,num):

            if (num % i) == 0:

                break

        else:

            print(num, end =' ')

print(" ")


#6. Program to reverse the given number and to check if number is palindrome

#Note: A palindrome number is a number that is same after reverse like 1221

Given_Num = 589371

Reverse_num = 0

while (Given_Num> 0):

    rem = Given_Num % 10

    Reverse_num = (Reverse_num * 10) + rem

    Given_Num = Given_Num // 10

print("Reversed Number of given num are :", Reverse_num)

if Given_Num == Reverse_num:

    print ("Number is palindrome")

else:

    print ("Number is not palindrome")


#7. Program to find any exponent value

def Exponent(base, exp):

    pow = exp

    res =1

    while (pow > 0):

        res = res*base

        pow =pow-1

    print("Exponent, base raise to the power is :", res)

Exponent(20,3)


#8. Program to find factorial of given number

number = 10

fact =1

if number<0:

    print("No Factorial for negative number")

elif number == 0:

    print("Factorial of zero is 1")

else:

    for i in range(number+1):

        fact = fact * i

    print ("The factorial of given number is :", fact)


#9. Program to display Multiplication table from 1 to 10

for i in range(1, 11):

    for j in range(1,11):

        print(i*j, end=' ')

    print(" ")


print(' ')

#10. Program to check if given year is leap year

def CheckLeapYear(Year):    

  if((Year % 400 == 0) or (Year % 100 != 0) and (Year % 4 == 0)):   

    print("Given year :", Year, " is leap Year");  

  else:  

    print ("Year :", Year, "  is not a leap Year")   

CheckLeapYear(2012)  

CheckLeapYear(2002)

CheckLeapYear(2020)


#11. Loop1 : Number pattern

print("Solution of Loop1 : Number pattern : ")

for i in range(1,6):

    for j in range(i):

        print(i, end=' ')

    print(" ")


#12. Loop2 : Right angled triangle star pattern with asterisk(*)

print("Solution of Loop2 : Right angled triangle star pattern with asterisk(*) : ")

for i in range(5,0,-1):

    for j in range(i):

        print("*", end=' ')

    print(" ") 


#13. Loop3 : different Number pattern

print("Solution of Loop3 : different Number pattern : ")

for i in range(1,6):

    for j in range(1,i+1):

        print(j, end=' ')

    print(" ")


#14. Loop4 : Half Pyramid pattern with number

print("Solution of Loop4 : Half Pyramid pattern with number : ")

for i in range(5,0,-1):

    for j in range(i,0,-1):

        print(j, end=' ')

    print(" ")


#15. Loop5: Pyramid star Pattern with asterisk(*)

print("Solution of Loop5: Pyramid star Pattern with asterisk(*) : ")

rows1 =6

rows2 =4

for i in range(1, rows1):

    for j in range(rows1-i-1):

        print(' ', end='')

    for k in range(0, 2 * i - 1):

        print('*', end = '')

    print(" ")


#16. Loop6: Inverted Pyramid star pattern with asterisk(*)

print("Solution of Loop6: Inverted Pyramid star Pattern with asterisk(*) : ")

rwo = 5

for i in range(rwo,0,-1):

    for j in range(rwo-i+1):

        print(' ', end='')

    for k in range(0,2*i -1):

        print('*', end = '')

    print(" ")


#17. Loop7 : Half diamond pattern with asterisk(*)

print("Solution of Loop7: Half diamond pattern with asterisk(*) : ")

for i in range(1,5):

    for j in range(i):

        print("*", end='')

    print(" ")    

for i in range(5,0,-1):

    for j in range(i):

        print("*", end='')

    print(" ")


#18. Loop8 : Mirror Half diamond pattern with asterisk(*)

print("Solution of Loop8: Mirror Half diamond pattern with asterisk(*) : ")

rows =6

for i in range(1,rows):

    for j in range(rows-1-i):

        print(' ', end='')

    for k in range(i):

        print("*", end='')

    print(" ")

for i in range(rows,0,-1):

    for j in range(rows-i+1):

        print(' ', end='')

    for l in range(i-2):

        print("*",end='')

    print(" ")


#19. Loop9 : Diamond Star pattern with asterisk(*)

print("Solution of Loop9: Diamond Star pattern with asterisk(*) : ")

rows1 =6

rows2 =4

for i in range(1, rows1):

    for j in range(rows1-i-1):

        print(' ', end='')

    for k in range(0, 2 * i - 1):

        print('*', end = '')

    print(" ")

for i in range(rows2,0,-1):

    for j in range(rows2-i+1):

        print(' ', end='')

    for k in range(0,2*i -1):

        print('*', end = '')

    print(" ")


#20. Loop10 : Rectangle Star pattern 

print("Solution of Loop10: Rectangle Star pattern : ")  

for i in range(5):

    for j in range(12):

        print("*", end=' ')

    print(" ")


#21. Loop11 : Square Star pattern 

print("Solution of Loop11: Square Star pattern : ")  

for i in range(5):

    for j in range(5):

        print("*", end=' ')

    print(" ")


#22. Loop12 : Rhombus Star pattern

print("Solution of Loop12: Rhombus Star pattern : ")  

for i in range(rows, 0, -1):

    for j in range(1, i):

        print(' ', end = '')

    for k in range(0, rows):

        print('*', end = '')

    print(" ")


#23. Loop13: Triangle Number pattern

print("Solution of Loop13:  Triangle Number pattern : ") 

for i in range(1, 6):

    for j in range(6-i-1):

        print(' ', end='')

    for k in range(0, 2 * i - 1):

        print(i, end = '')

    print(" ")


#24. Create function 'Employee' with two argument, Emp_name and salary

#Declaration of function

def Employee(Emp_name, salary):

    print("Function Declaration :", Emp_name, salary)

#Calling the function

Employee("Akansha",30000)


#25. Create function Employee calling multiple arguments at a time using one function

def Employee(*args):

    for i in args:

        print("Calling multiple arguments :", i)

Employee("Akansha","Isha")

Employee("Isha", "Akansha", "Sakshi")


#26. Create a function 'Employee' with salary as default argument and it can be changed also after calling the function

def Employee(Emp_name, salary=25000):

    print(Emp_name, salary)

Employee("Akansha")

Employee("Isha", 20000)


#27. Change the name of function 'Employee' to 'Employee_Details

def Employee(Emp_name, salary):

    print(Emp_name, salary)

#Assigning different function name

Employee_Details = Employee

Employee("Akansha",30000)


#28. Find the Factorial  of given number using recursion function

def Factorial_Recursion(num):

    if num == 1:

        return num

    else:

        return num*Factorial_Recursion(num-1)

Given_num = int(input("Enter factorial number :"))

if Given_num < 0:

    print("No factorial for negative integers")

elif Given_num == 0:

    print("Factorial of zero is 1")

else:

    print(("Factorial of given number is :", Factorial_Recursion(Given_num)))


Result of above Exercise

Enter Number to calculate sum :5

Sum of the all numbers : 15

count of all digits in given number : 6

Numbers from -5 to -1 are :

-5 -4 -3 -2 -1  

Fibonacci series upto 10 numbers are :

0 1 1 2 3 5 8 13 21 34  

All prime numbers upto 2 to 20 numbers are :

2 3 5 7 11 13 17 19  

Reversed Number of given num are : 173985

Number is not palindrome

Exponent, base raise to the power is : 8000

The factorial of given number is : 0

1 2 3 4 5 6 7 8 9 10  

2 4 6 8 10 12 14 16 18 20  

3 6 9 12 15 18 21 24 27 30  

4 8 12 16 20 24 28 32 36 40  

5 10 15 20 25 30 35 40 45 50  

6 12 18 24 30 36 42 48 54 60  

7 14 21 28 35 42 49 56 63 70  

8 16 24 32 40 48 56 64 72 80  

9 18 27 36 45 54 63 72 81 90  

10 20 30 40 50 60 70 80 90 100  


Given year : 2012  is leap Year

Year : 2002   is not a leap Year

Given year : 2020  is leap Year

Solution of Loop1 : Number pattern : 

1  

2 2  

3 3 3  

4 4 4 4  

5 5 5 5 5  

Solution of Loop2 : Right angled triangle star pattern with asterisk(*) : 

* * * * *  

* * * *  

* * *  

* *  

*  

Solution of Loop3 : different Number pattern : 

1  

1 2  

1 2 3  

1 2 3 4  

1 2 3 4 5  

Solution of Loop4 : Half Pyramid pattern with number : 

5 4 3 2 1  

4 3 2 1  

3 2 1  

2 1  

1  

Solution of Loop5: Pyramid star Pattern with asterisk(*) : 

    * 

   *** 

  ***** 

 ******* 

********* 

Solution of Loop6: Inverted Pyramid star Pattern with asterisk(*) : 

 ********* 

  ******* 

   ***** 

    *** 

     * 

Solution of Loop7: Half diamond pattern with asterisk(*) : 

** 

*** 

**** 

***** 

**** 

*** 

** 

Solution of Loop8: Mirror Half diamond pattern with asterisk(*) : 

    * 

   ** 

  *** 

 **** 

***** 

 **** 

  *** 

   ** 

    *       

Solution of Loop9: Diamond Star pattern with asterisk(*) : 

    * 

   *** 

  ***** 

 ******* 

********* 

 ******* 

  ***** 

   *** 

    * 

Solution of Loop10: Rectangle Star pattern : 

* * * * * * * * * * * *  

* * * * * * * * * * * *  

* * * * * * * * * * * *  

* * * * * * * * * * * *  

* * * * * * * * * * * *  

Solution of Loop11: Square Star pattern : 

* * * * *  

* * * * *  

* * * * *  

* * * * *  

* * * * *  

Solution of Loop12: Rhombus Star pattern : 

     ****** 

    ****** 

   ****** 

  ****** 

 ****** 

****** 

Solution of Loop13:  Triangle Number pattern : 

    1 

   222 

  33333 

 4444444 

555555555 

Function Declaration : Akansha 30000

Calling multiple arguments : Akansha

Calling multiple arguments : Isha

Calling multiple arguments : Isha

Calling multiple arguments : Akansha

Calling multiple arguments : Sakshi


Akansha 25000

Isha 20000

Akansha 30000


Enter factorial number :5

('Factorial of given number is :', 120)

Friday 14 January 2022

Numpy Exercise by Python

 Numpy is Numerical Python, an open source data science library of python which is used mainly for the arrays, matrices calculation. This library provides lot of supporting functions which make the complex mathematical calculation of arrays very easy. Numpy are often used with other python libraries like pandas, scipy and matplotlib to solve complex problem in short span of time and show the result accurately.

Below are the set of  multiple questions which will help to give the basic knowledge of all type of programming of Numpy Data science library in Python. You can visit website https://www.w3resource.com/python-exercises/numpy/ orhttps://www.geeksforgeeks.org/python-numpy-practice-exercises-questions-and-solutions/

Steps to run below programs:

  1. Install Anaconda in your PC/ Laptop.
  2. Open Spyder.
  3. Copy and paste below programs.
  4. Press Run button. You can see the result in Console section at right side.

#1. Declaration of Numpy , create arrays of zeros, ones, fifties

import numpy as np

arr = np.zeros(5)

print("Zeros array in numpy are:", arr)

arr_z= np.zeros(shape=(2,3), dtype='int')

print("Zeros array with diff shape in numpy are:",arr_z)

arr1 = np.ones(5)

print("Ones array in numpy are:",arr1)

arr2 = np.ones(5)*50

print("50th value array in numpy are:", arr2)


#2. creation of random numbers b/w 0 and 1

rand= np.random.normal(0,1,1)

print("Random values from 0 to 1 are: ", rand)

rand1 = np.random.normal(0,1,25)

print("25 Random values from 0 to 1 are: ",rand1)


#3. create a vector with values ranging from 10 to 19, with reshaping

vec= np.arange(10,19)

print("Vector with values from 10 to 19 are: ", vec)

vec_rev= vec[::-1]

print("Reversing of vector: ", vec_rev)

vec1 = vec.reshape(3,3)

print("Reshaping of Vector \n: ", vec1)

print ('\n')


#4. creation of identity matrix

Iden= np.eye(3)

print("Identity Matrix is \n:", Iden)

print ('\n')


#5. create 3*3 matrix with values ranging from 2 to 10

mat =  np.arange(2, 11).reshape(3,3)

print("3*3 matrix with values ranging from 2 to 10 \n:", (mat))

print ('\n')


#6. Write a NumPy program to convert a list and tuple into arrays.

my_list = [1, 2, 3, 4, 5, 6, 7, 8]

print("List to array: ")

print(np.asarray(my_list))

my_tuple = ([8, 4, 6], [1, 2, 3])

print("Tuple to array: ")

print(np.asarray(my_tuple))


#7. Write a NumPy program to append values to the end of an array.

import numpy as np

x = [10, 20, 30]

print("Original array:")

print(x)

x = np.append(x, [[40, 50, 60], [70, 80, 90]])

print("After append values to the end of the array:")

print(x)


#8. Write a NumPy program to construct an array by repeating.

#Sample array: [1, 2, 3, 4]

a = [1, 2, 3, 4]

print("Original array:")

print(a)

print("2 times repeating the same array:")

x = np.tile(a, 2)

print(x)

print("3 times repeating the same array:")

x = np.tile(a, 3)

print(x)


#9. Write a NumPy program to change the dimension of an array.

x = np.array([1, 2, 3, 4, 5, 6])

print("Shape of array is: ", x.shape)

print("Size of array is: ", x.size)


y = np.array([[1, 5, 2],[6, 7, 1],[3,8,4]])

print("Make array of 3 rows and 3 colums \n :",y)

print ('\n')


x = np.array([5,3,11,4,5,9,7,25,19])

x.shape = (3, 3)

print("Change shape of given array into 3 rows and 3 columns \n: ", x)

print ('\n')


#10. Mathematical practice for Numpy

print("Addition: ", np.add(55, 30))

print("Subtraction: ", np.subtract(55, 30))

print("Multiplication :", np.multiply(55, 30))

print("Division :", np.divide(55,30))

expo = np.arange(5)

print("Originial term are: ", expo)

expo_result = np.power(expo,3)

print("Originial term are: ", expo_result)


abs =np.array([-2.3, 6.8, -9.1])

abs_result = np.absolute(abs)

print("Absolute Value are: ", abs_result)


#11. Round array elements of given decimals to nearest value

round_element = np.round([1.6, 2.4, 0.34, 7.8, 8.1])

print("Round Values of given array are: ",round_element)


#12. find max and min value of array

arr_max_min = np.arange(6).reshape((2,3))

print(arr_max_min)

print("Max value of array \n: ",(np.amax(arr_max_min)))

print ('\n')

print("Min value of array \n: ", (np.amin(arr_max_min)))

print ('\n')

print("Sum of all the elements \n: ", (arr_max_min.sum()))

print ('\n')


#13. Matrix addition and multiplication of two arrays

mat1 = [[4, 5], [2,5], [6,2]]

mat2 = [[5,7,1], [6,9,3]]

print("Matrix multiplication \n: ", (np.matmul(mat1,mat2)))

print ('\n')


#14. Another method of addition, multiplication, Division, Concatenation (Vertical stacking and horizontal stacking)

mat1_np = np.array([[4, 5], [2,5]])

mat2_np = np.array([[5,7], [6,9]])

print("Another method of Matrix addition \n: ", mat1_np + mat2_np)

print ('\n')

print("Another method of Matrix multiplication \n: ", mat1_np * mat2_np)

print ('\n')

print("Another method of Matrix Division \n: ", mat1_np / mat2_np)

print ('\n')

print("Concatenation, Vertical stacking: \n :", np.vstack((mat1_np,mat2_np)));

print ('\n')

print("Concatenation, horizontally stacking \n :", np.hstack((mat1_np,mat2_np)));

print ('\n')


#15. calculate inverse sine value (trignometric function)

sine_value = np.array([-1., 0, 1.])

print("Inverse Sine Value: ", np.arcsin(sine_value))

print ('\n')


#16. Array Iteration

mat_iter = np.array([[5,7], [6,9]])

print("Array before Iterating: /n", mat_iter)    

print("Array after Iterating: /n")  

for x in np.nditer(mat_iter):

    print(x, end=' ')

print ('\n')


#17. Transpose of Array

mat_Trans = np.array([[5,7], [6,9]])

print("Transpose of array: \n", mat_Trans.T)

print ('\n')


#18. Find mean, median, average of array

m = np.array([[4,7,5],[6,2,8],[3,1,7]])

print("Original array: \n", m)

print('\n')

print("Mean of array along axis 0 :", np.mean(m,0))

print("Median of array along axis 1 :", np.median(m,0))

print("Average of array along axis 1 :", np.average(m,1))

print("\n")


Result of above Exercise

Zeros array in numpy are: [0. 0. 0. 0. 0.]

Zeros array with diff shape in numpy are: [[0 0 0]

 [0 0 0]]

Ones array in numpy are: [1. 1. 1. 1. 1.]

50th value array in numpy are: [50. 50. 50. 50. 50.]

Random values from 0 to 1 are:  [0.1241432]

25 Random values from 0 to 1 are:  [ 0.62204881 -0.82931417  0.23603654 -1.29256341 -1.68773158  0.09786349

 -0.63253742  0.64259035  1.60333346  0.27708779 -0.36226831  0.094398

 -1.31297426  0.29043894  0.37204664  0.06414133 -0.96859801 -0.59008381

  0.19558017 -0.13458364  0.03206455 -0.89067194 -0.56143579  0.19745269

  0.04995617]

Vector with values from 10 to 19 are:  [10 11 12 13 14 15 16 17 18]

Reversing of vector:  [18 17 16 15 14 13 12 11 10]

Reshaping of Vector 

:  [[10 11 12]

 [13 14 15]

 [16 17 18]]


Identity Matrix is 

: [[1. 0. 0.]

 [0. 1. 0.]

 [0. 0. 1.]]


3*3 matrix with values ranging from 2 to 10 

: [[ 2  3  4]

 [ 5  6  7]

 [ 8  9 10]]


List to array: 

[1 2 3 4 5 6 7 8]

Tuple to array: 

[[8 4 6]

 [1 2 3]]

Original array:

[10, 20, 30]

After append values to the end of the array:

[10 20 30 40 50 60 70 80 90]

Original array:

[1, 2, 3, 4]

2 times repeating the same array:

[1 2 3 4 1 2 3 4]

3 times repeating the same array:

[1 2 3 4 1 2 3 4 1 2 3 4]

Shape of array is:  (6,)

Size of array is:  6

Make array of 3 rows and 3 colums 

 : [[1 5 2]

 [6 7 1]

 [3 8 4]]


Change shape of given array into 3 rows and 3 columns 

:  [[ 5  3 11]

 [ 4  5  9]

 [ 7 25 19]]


Addition:  85

Subtraction:  25

Multiplication : 1650

Division : 1.8333333333333333

Originial term are:  [0 1 2 3 4]

Originial term are:  [ 0  1  8 27 64]

Absolute Value are:  [2.3 6.8 9.1]

Round Values of given array are:  [2. 2. 0. 8. 8.]

[[0 1 2]

 [3 4 5]]

Max value of array 

:  5


Min value of array 

:  0


Sum of all the elements 

:  15


Matrix multiplication 

:  [[50 73 19]

 [40 59 17]

 [42 60 12]]


Another method of Matrix addition 

:  [[ 9 12]

 [ 8 14]]


Another method of Matrix multiplication 

:  [[20 35]

 [12 45]]


Another method of Matrix Division 

:  [[0.8        0.71428571]

 [0.33333333 0.55555556]]


Concatenation, Vertical stacking: 

 : [[4 5]

 [2 5]

 [5 7]

 [6 9]]


Concatenation, horizontally stacking 

 : [[4 5 5 7]

 [2 5 6 9]]


Inverse Sine Value:  [-1.57079633  0.          1.57079633]


Array before Iterating: /n [[5 7]

 [6 9]]

Array after Iterating: /n

5 7 6 9 


Transpose of array: 

 [[5 6]

 [7 9]]


Original array: 

 [[4 7 5]

 [6 2 8]

 [3 1 7]]


Mean of array along axis 0 : [4.33333333 3.33333333 6.66666667]

Median of array along axis 1 : [4. 2. 7.]

Average of array along axis 1 : [5.33333333 5.33333333 3.66666667]


Sunday 9 January 2022

Object Oriented Programming (Classes and Inheritance) Exercise by python

Below are the set of  20 questions which will help to give the basic knowledge of all type of programming on classes and Inheritance in Python. You can visit website pynative.com or https://www.geeksforgeeks.org/.

Steps to run below programs:

  1. Install Anaconda in your PC/ Laptop.
  2. Open Spyder.
  3. Copy and paste below programs.
  4. Press Run button. You can see the result in Console section at right side.

#1. Program to create a class Employee without any variables and methods

#Answer: 

#Solution:   

class Employee:

    pass


#2. Program to create child class Animal that will inherit all variables and methods of Bird class

#Answer: Parrot 10

#Solution:  

class Animal:

    def __init__(self, name, age):

        self.name = name

        self.age = age

class Bird(Animal):

    pass

bird_detail = Bird("Parrot", 10)

print(bird_detail.name, bird_detail.age)


#3. Program to determine the type of class, and also if child class is an instance of Parent class

#Answer: Type of class:  <class '__main__.Birds'> , Instance of class:  True

#Solution: 

class Animals:

    def __init__(self, name, age):

        self.name = name

        self.age = age

class Birds(Animals):

    pass

bird_details = Birds("Parrot", 10)

print("Type of class: ", type(bird_details))

print("Instance of class: ", isinstance(bird_details, Animals))


#4. Program of Object Oriented Programming, inheritance with default value of variables

#Answer: The color of animal Parrot is white passengers

#Solution:    

class Animals:

    def __init__ (self, name, age):

        self.name = name

        self.age = age   

    def animal_color (self, color):

        return f"The color of animal {self.name} is {color} passengers"


class Birds(Animals):

    def animal_color(self, color="white"):

        return super().animal_color(color="white")


animal_check = Birds("Parrot", 10)

print (animal_check.animal_color())


#5. Write a program with the property that has same value for every object

#Answer: Parrot 10 Black , Snake 8 Black

#Solution: 


class Animal1:

    color = "Black"

    def __init__ (self, name, age):        

        self.name = name

        self.age = age


class Bird1(Animal1):

    pass


class Reptiles(Animal1):

    pass

animal_check = Bird1("Parrot", 10)

print (animal_check.name, animal_check.age, animal_check.color)


animal_check = Reptiles("Snake", 8)

print (animal_check.name, animal_check.age, animal_check.color)