Matplotlib is the open source data science library of python which is used mainly for the visualization of data. The Pyplot package in the matplot library is helpful in plotting the 2-D figure. There are multiple type pf plot or graphs are present in matplotlib which is helpful in analysis of huge data by visualization like Line plot, bar plot, scatter plot, pie plot, histogram, Box plot.
import numpy as np
import pandas as pd
import matplotlib.pyplot as plt
#1. Learn Matplotlib: Line graph
ps1 = pd.Series([5,9,13,18,21])
ps2 = pd.Series([2,8,9,11,4])
plt.plot(ps1,ps2)
plt.xlabel('x - axis: Series1')
plt.ylabel('y - axis: Series2')
plt.title('Learn Matplotlib')
plt.show()
#2. show data using file
df = pd.read_csv("data.csv")
df.plot()
plt.show()
#3. to show legend on the plot
ps1 = pd.Series([5,9,13,18,21])
ps2 = pd.Series([2,8,9,11,4])
ps3 = pd.Series([8,10,12,16,18])
plt.plot(ps1,ps2, label = "line 1")
plt.plot(ps1,ps3, label = "line 2")
plt.xlabel('x - axis: Series1')
plt.ylabel('y - axis: Series2')
plt.title('show-legend: Learn Matplotlib')
plt.legend()
plt.show()
#4. Show the line on the plot with different colors and width
ps1 = pd.Series([5,9,13,18,21])
ps2 = pd.Series([2,8,9,11,4])
ps3 = pd.Series([8,10,12,16,18])
plt.plot(ps1,ps2, color='Red', linewidth = 6, label = "line 1")
plt.plot(ps1,ps3, color='blue', linewidth = 5, label = "line 2")
plt.xlabel('x - axis: Series1')
plt.ylabel('y - axis: Series2')
plt.title('plot lines with different color and width: Learn Matplotlib')
plt.legend()
plt.show()
#5. plot lines with different linestyles
ps1 = pd.Series([5,9,13,18,21])
ps2 = pd.Series([2,8,9,11,4])
ps3 = pd.Series([8,10,12,16,18])
plt.plot(ps1,ps2, color='Red', linewidth = 2, linestyle='dashed', label = "line 1")
plt.plot(ps1,ps3, color='blue', linewidth = 3.5, linestyle='dotted', label = "line 2")
plt.xlabel('x - axis: Series1')
plt.ylabel('y - axis: Series2')
plt.title('plot lines with different linestyles: Learn Matplotlib')
plt.legend()
plt.show()
#6. plot lines with different line markers
ps1 = pd.Series([5,9,13,18,21])
ps2 = pd.Series([2,8,9,11,4])
ps3 = pd.Series([8,10,12,16,18])
plt.plot(ps1,ps2, color='Red', linewidth = 2, linestyle='dashed', marker='*', markerfacecolor='blue', markersize=6, label = "line 1")
plt.plot(ps1,ps3, color='blue', linewidth = 3.5, linestyle='dotted',marker='o', markerfacecolor='Red', markersize=6, label = "line 2")
plt.xlabel('x - axis: Series1')
plt.ylabel('y - axis: Series2')
plt.title('plot lines with different line markers: Learn Matplotlib')
plt.legend()
plt.show()
#7. set the new axis limit values on the plot, Limit x-axis 0 to 25, Limit y-axis 0 to 200
ps1 = pd.Series([5,9,13,18,21])
ps2 = pd.Series([50,123,145,161,189])
#new way to plot red line with 'o' marker
plt.plot(ps1,ps2, 'r-o', linewidth = 2, label = "line 1")
plt.axis([0, 25, 0, 200])
plt.xlabel('x - axis: Series1')
plt.ylabel('y - axis: Series2')
plt.title('plot lines with different line markers: Learn Matplotlib')
plt.show()
#8. plotting the grid
ps1 = pd.Series([5,9,13,18,21])
ps2 = pd.Series([50,123,145,161,189])
plt.plot(ps1,ps2, color='blue', linewidth = 2, label = "line 1")
plt.axis([0, 25, 0, 200])
plt.xlabel('x - axis: Series1')
plt.ylabel('y - axis: Series2')
plt.title('plot lines with different line markers: Learn Matplotlib')
plt.grid(linestyle='-', linewidth='1.5', color='orange')
plt.show()
#9. scatter plot
ps1 = pd.Series([5,9,13,18,21])
ps2 = pd.Series([2,8,9,11,4])
ps3 = pd.Series([8,10,12,16,18])
plt.scatter(ps1,ps2, color='Red', label = "scatter 1")
plt.scatter(ps1,ps3, color='blue', label = "scatter 2")
plt.xlabel('x - axis: Series1')
plt.ylabel('y - axis: Series2')
plt.title('Scatter plot: Learn Matplotlib')
plt.legend()
plt.show()
#10. scatter plot using multiple random number
x1 = np.random.randn(100)
y1 = np.random.randn(100)
plt.scatter(x1,y1, color='Red')
plt.xlabel('x - axis: Series1')
plt.ylabel('y - axis: Series2')
plt.title('Scatter plot with random number: Learn Matplotlib')
plt.show()
#11. changing the colour with empty circles in scatter plot
x1 = np.random.randn(100)
y1 = np.random.randn(100)
plt.scatter(x1,y1, s=55, facecolors='none', edgecolors='green')
plt.xlabel('x - axis: Series1')
plt.ylabel('y - axis: Series2')
plt.title('Scatter plot with empty circles: Learn Matplotlib')
plt.show()
#12. Vertical Bar Chart
x =['CSE Jobs','IT Jobs', 'ECE Jobs','MAE jobs','Civil Jobs']
y=[50000,45000,30000,25000,21000]
plt.bar(x, y)
plt.xlabel("Jobs")
plt.ylabel("Num of Jobs")
plt.title("Bar Chart: Vertical")
plt.show()
#13. Horizontal Bar Chart
y =['CSE Jobs','IT Jobs', 'ECE Jobs','MAE jobs','Civil Jobs']
x=[50000,45000,30000,25000,21000]
plt.barh(y, x)
plt.xlabel("Num of Jobs")
plt.ylabel("Jobs")
plt.title("Bar Chart: Horizontal")
plt.show()
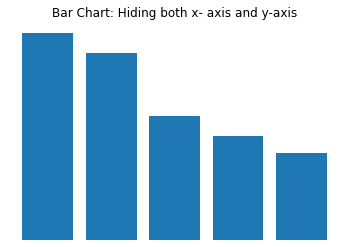
#14. To hide the both x-axis and y-axis in plot
x =['CSE Jobs','IT Jobs', 'ECE Jobs','MAE jobs','Civil Jobs']
y=[50000,45000,30000,25000,21000]
plt.bar(x, y)
plt.xlabel("Jobs")
plt.ylabel("Num of Jobs")
plt.title("Bar Chart: Hiding both x- axis and y-axis")
plt.axis('off')
plt.show()
#15. If only need to hide/ off either x-axis or y-axis. We can use plt.xticks() and plt.yticks()
x =['CSE Jobs','IT Jobs', 'ECE Jobs','MAE jobs','Civil Jobs']
y=[50000,45000,30000,25000,21000]
plt.bar(x, y)
plt.xlabel("Jobs")
plt.ylabel("Num of Jobs")
plt.title("Bar Chart: Hiding only x- axis")
plt.xticks([])
plt.show()
#16. Saving the plot using savefig() and bbox_inches ='tight' to remove/hide whitespace around border
x =['CSE Jobs','IT Jobs', 'ECE Jobs','MAE jobs','Civil Jobs']
y=[50000,45000,30000,25000,21000]
plt.bar(x, y)
plt.xlabel("Jobs")
plt.ylabel("Num of Jobs")
plt.title("Bar Chart: Saving the plot using savefig")
plt.savefig('Bar_Chart_pratice.png', bbox_inches='tight', pad_inches=0)
plt.show()
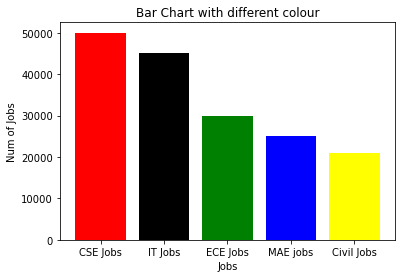
#17. Display the Bar chart with different colour of Bar
x =['CSE Jobs','IT Jobs', 'ECE Jobs','MAE jobs','Civil Jobs']
y=[50000,45000,30000,25000,21000]
plt.bar(x, y,color=['red', 'black', 'green', 'blue', 'yellow'])
plt.xlabel("Jobs")
plt.ylabel("Num of Jobs")
plt.title("Bar Chart with different colour")
plt.show()
#18. Pie chart
Jobs =['CSE Jobs','IT Jobs', 'ECE Jobs','MAE jobs','Civil Jobs']
Percent=[50,45,30,25,21]
fig = plt.figure(figsize =(10, 7))
plt.pie(Percent,labels=Jobs)
plt.title("Pie Chart")
plt.show()
#19. Learn Distribution Graph: Histogram
x = 2 +3*(np.random.randn(1000))
fig = plt.figure(figsize=(8,6))
ax = fig.add_subplot(111)
ax.set(title="Distribution Graph: Histogram", xlabel='Percentage',ylabel='Count')
ax.hist(x)
plt.show()
#20. Setting the color of bar and number of bins in Histogram
x = 2 +3*(np.random.randn(1000))
fig = plt.figure(figsize=(8,6))
ax = fig.add_subplot(111)
ax.set(title="Distribution Graph: Histogram with changed colors and bins", xlabel='Percentage',ylabel='Count')
ax.hist(x, color='Red', bins=30, density=True)
plt.show()
#21. Box plot: to visulaize the spread of data, detect outliers
x = 2 +3*(np.random.randn(1000))
fig = plt.figure(figsize=(8,6))
ax = fig.add_subplot(111)
ax.set(title="Box Plot", xlabel='Student Class',ylabel='Percentage of Student')
ax.boxplot(x)
plt.show()
#22. Box plot with Notch, bootstrap, Vert
#Notch: It will be True if notches created around median. Bootstrap number will show that notches around the median are bootstrapped
x = 2 + 3*np.random.randn(1000)
y = 4 + 5*np.random.randn(1000)
fig = plt.figure(figsize=(8,6))
ax = fig.add_subplot(111)
ax.set(title="Box plot of Student's Percentage",
xlabel='Class', ylabel='Percentage')
ax.boxplot([x, y], labels=['Class A', 'Class B'], notch=True, bootstrap=15000)
plt.show()
#23. Horizontal Box Plot using vert. Vert will be False for plotting Box plots horizontally
x = 2 + 3*np.random.randn(1000)
y = 4 + 5*np.random.randn(1000)
fig = plt.figure(figsize=(8,6))
ax = fig.add_subplot(111)
ax.set(title="Box plot of Student's Percentage",
xlabel='Class', ylabel='Percentage')
ax.boxplot([x, y], labels=['Class A', 'Class B'], notch=True, bootstrap=15000, vert=False)
plt.show()
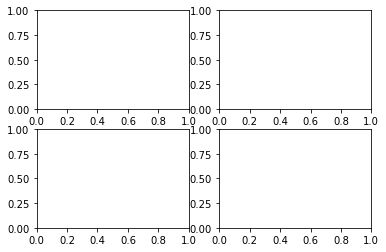
#24. Creating subplot with same rows and columns but with different index value.
fig = plt.figure(figsize=(6,4))
ax1 = plt.subplot(221)
ax2 = plt.subplot(222)
ax3 = plt.subplot(223)
ax4 = plt.subplot(224)
plt.show()
#25. Creating different subplot
fig = plt.figure(figsize=(6,4))
ax1 = plt.subplot(2,2,(1,2))
ax3 = plt.subplot(223)
ax4 = plt.subplot(224)
plt.show()


No comments:
Post a Comment